ICT Weekly Profiles — 12 Patterns to Identify the Weekly High & Low + Free PDF

Over 150 pages of knowledge coming from 8+ years of experience from Professional ICT Trader.
👉 Buy Now!
ICT Weekly Profiles are conceptual frameworks Michael Huddleston taught for reading the typical day-by-day delivery of price across a single trading week. There are 12 distinct weekly profiles, and each one describes a different pattern of how the high and low of the week are likely to form — Tuesday low, Wednesday high, Thursday consolidation reversal, midweek expansion, and so on.
I use the Weekly Profiles to anticipate where the high and low of the week will likely print BEFORE the week unfolds. That changes how I plan trades on Monday and Tuesday — instead of reacting to each day, I am positioning for the weekly extreme that the dominant profile suggests.
The profiles are not fixed predictions. They are tendencies — frameworks to read price against. Combined with a clear higher-timeframe bias and the right premium / discount context, they sharpen weekly setups significantly.
This guide is the full breakdown of all 12 ICT Weekly Profiles — what each one looks like, when to anticipate it, the higher-timeframe filters that signal which profile is in play, the common mistakes I see traders make, and the answers to the questions I get most often.
What is an ICT Weekly Profile?
An ICT Weekly Profile is a conceptual framework that describes a typical pattern of price behaviour during a trading week. Each profile has unique characteristics — a specific day on which the weekly high or low forms, a specific direction of the dominant move, and a specific higher-timeframe condition that makes that profile likely.
These profiles are not fixed predictions. They are weekly tendencies that institutions tend to deliver, and the trader who recognises which profile is in play has a meaningful edge in positioning early in the week.
The 12 profiles below cover the dominant patterns. In any given week, price will follow one of them. Reading the higher-timeframe premium / discount context on Monday tells me which one is most likely.
(I) Classic Tuesday Low of the Week
Bullish Profile: When price is in a bullish higher-timeframe context, it may manipulate on Monday and hover above a higher-timeframe discount array. Then on Tuesday it drops into the higher-timeframe discount array to form the low of the week.

To anticipate this profile, you should know the higher-timeframe discount array. When the market fails to drop into the discount array on Monday, it is most likely that Tuesday will see the drive lower to mark the weekly low in London or New York session.
(II) Classic Tuesday High of the Week
Bearish Profile: When price is in a bearish higher-timeframe context, it may manipulate on Monday and hover below a higher-timeframe premium array. Then on Tuesday it rises into the higher-timeframe premium array to form the high of the week.
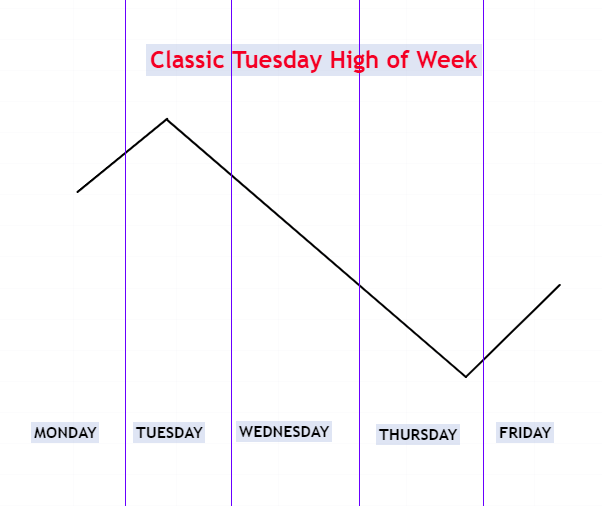
To anticipate this, you should know the higher-timeframe Premium array. When the market fails to rise into the premium array on Monday, it is most likely that Tuesday will see the drive higher to mark the weekly high in London or New York session.
(III) Wednesday Low of the Week
Bullish Profile: When price is bullish, it may manipulate on Monday and Tuesday and hover above a higher-timeframe discount array. Then on Wednesday it drops into the higher-timeframe discount array to form the low of the week.
✨ Update: I've launched my ICT Trading Strategies PDF eBook! Check it out at ictpdf.com .

To anticipate this, you should know the higher-timeframe Discount Array. When the market fails to drop into the discount array on Monday and Tuesday, it is most likely that Wednesday will see the drive lower to mark the weekly low in London or New York session.
(IV) Wednesday High of the Week
Bearish Profile: When price is bearish, it may manipulate on Monday and Tuesday and hover below a higher-timeframe premium array. Then on Wednesday it rises into the higher-timeframe premium array to form the high of the week.

To anticipate this, you should know the higher-timeframe premium array. When the market fails to rise into the premium array on Monday and Tuesday, it is most likely that Wednesday will see the drive higher to mark the weekly high in London or New York session.
(V) Consolidation Thursday Bullish Reversal
When price is bullish, it may consolidate Monday through Wednesday, then runs the intra-week low and rejects it forming a market reversal.

To anticipate this, you must know the higher-timeframe discount array. When price fails to drop into the higher-timeframe discount array, it is likely that Thursday will see a drive lower on market-driver news or an interest rate release in late New York session, around 02:00 PM New York local time.
(VI) Consolidation Thursday Bearish Reversal
When price is bearish, it may consolidate Monday through Wednesday, then runs the intra-week high and rejects it forming a market reversal.

To anticipate this, you must know the higher-timeframe premium array. When price fails to rise into the higher-timeframe premium array, it is likely that Thursday will see a drive higher on market-driver news or an interest rate release in late New York session, around 02:00 PM New York local time.
(VII) Consolidation Midweek Rally
Bullish Profile: When price is bullish and consolidates Monday through Wednesday, then runs into the intra-week high and expands higher into Friday.

How to anticipate. When price is bullish and has yet to run to the premium array on the higher timeframe, and it has recently rallied from a discount array and simply paused without any bearish reversal price action — that indicates price is about to expand higher for the premium array.
(VIII) Consolidation Midweek Decline
Bearish Profile: When price is bearish and consolidates Monday through Wednesday, then runs into the intra-week low and expands lower into Friday.

How to anticipate. When price is bearish and has yet to run to the discount array on the higher timeframe, and it has recently declined from a premium array and simply paused without any bullish reversal price action — that indicates price is about to expand lower for the discount array.
(IX) Seek and Destroy Bullish Friday
Neutral-Low Probability Profile: When price consolidates Monday through Thursday running shallow stops under and above the intra-week high, then runs the intra-week high and expands higher into Friday.

How to anticipate. When the market is awaiting interest rate announcements or Non-Farm Payroll, it can create this profile in the summer months of July and August. Better to avoid trading in these conditions.
(X) Seek and Destroy Bearish Friday
Neutral-Low Probability Profile: When price consolidates Monday through Thursday running shallow stops under and above the intra-week high, then runs the intra-week low and expands lower into Friday.

How to anticipate. When the market is awaiting interest rate announcements or Non-Farm Payroll, it can create this profile in the summer months of July and August. Better to avoid trading in these conditions. For the dedicated breakdown of this Friday-specific reversal pattern, see the ICT Seek and Destroy Friday guide.
(XI) Wednesday Weekly Bullish Reversal
When price is bullish and consolidates Monday through Tuesday, then drives lower into the higher-timeframe discount array on Wednesday to induce sell stops, and then strongly reverses.

When the market is trading at the long-term or intermediate-term low, price will pair institutional buying with pending sell-side liquidity — the classic sell-stops raid before the reversal.
(XII) Wednesday Weekly Bearish Reversal
When price is bearish and consolidates Monday through Tuesday, then drives higher into the higher-timeframe premium array on Wednesday to induce buy stops, and then strongly reverses.

When the market is trading at the long-term or intermediate-term high, price will pair institutional selling with pending buy-side liquidity — the classic buy-stops raid before the reversal.
How to Use ICT Weekly Profiles in Your Trading
The Weekly Profiles are not a setup in themselves — they are a directional framework that tells me what to expect for the week. I use them as the weekly anchor on top of which I run intraday models like the Silver Bullet, the OTE, and the 1st Presented FVG.
The workflow I run every Monday morning:
- Read the higher-timeframe context on the daily and weekly charts. Is price bullish or bearish on the higher timeframe? Is there a clear premium or discount array still untouched?
- Identify the most likely profile based on the daily-bias and PD-array conditions. If the higher-timeframe discount sits below current price and the bias is bullish, expect a Tuesday Low or Wednesday Low profile. If price has consolidated for two days without reaching the array, the bias-aligned profile becomes more probable.
- Set the weekly target — the high or low you expect to print, and the day you expect it to print on. This is the directional anchor for every intraday trade in that week.
- Run intraday setups in the direction of the profile. If the Tuesday Low profile is in play, every Monday and early-Tuesday intraday entry should align toward shorting into the discount array, then reversing for the bullish move once the weekly low forms.
- Adjust mid-week if the profile invalidates. If by Wednesday close the expected weekly extreme has not formed, price has likely shifted to a different profile. Re-read the chart from the new conditions.
USA Trading Note — ES & NQ Futures
For US-based traders, the Weekly Profiles are most reliable on US index futures — NASDAQ 100 (NQ Futures) and the E-mini S&P 500 (ES Futures). The CME futures session structure makes the day-by-day profile read very clean. ES and NQ are CFTC-regulated futures and execute through a US futures broker (NinjaTrader, AMP, Tradovate, or a prop firm such as Topstep). The major USD forex pairs (GBP/USD, EUR/USD) and Gold (XAU/USD) also respect Weekly Profile mechanics. TradingView is for chart analysis only.
Common Mistakes I See Traders Make on Weekly Profiles
Five mistakes account for the majority of failed Weekly Profile reads. Avoid these and the framework converts at a much higher rate.
- Reading the profile without the higher-timeframe PD Array context. The profiles are anchored to the higher-timeframe premium and discount arrays. Without identifying those levels first, you cannot tell which profile is in play. Always set the PD Array context before assigning the profile.
- Forcing a profile early in the week. By Monday close, only a few profiles can be ruled out — most are still possible. Wait for Tuesday and Wednesday’s price action to narrow the read. Do not commit to a profile prematurely.
- Trading the Friday Seek-and-Destroy profiles. Profile IX and X are explicitly low-probability and tied to NFP / interest-rate uncertainty. The right play is to skip those weeks, not trade them harder.
- Ignoring 02:00 PM NY local on Thursdays. Profiles V and VI both pivot around the late-NY news drive. If you are not aware of the day’s news calendar, you will misread the move as random when it is actually the profile delivering on schedule.
- Treating the profile as a guarantee. The profiles are tendencies, not predictions. Any given week can fail to follow any profile. Always run risk management as if the profile read could be wrong.
FAQs About ICT Weekly Profiles
What are ICT Weekly Profiles?
ICT Weekly Profiles are 12 conceptual frameworks Michael Huddleston taught for reading the typical day-by-day delivery of price across a trading week. Each profile describes a different pattern for how the high and low of the week are likely to form.
How many ICT Weekly Profiles are there?
Twelve. They cover the Tuesday Low and High patterns, the Wednesday Low and High patterns, four Consolidation profiles (Thursday Reversals and Midweek Expansions), the two low-probability Friday Seek-and-Destroy profiles, and two Wednesday Weekly Reversal profiles.
Which Weekly Profile prints most often?
The Tuesday Low (in bullish weeks) and Tuesday High (in bearish weeks) are the most common in normal market conditions. The Consolidation Thursday Reversals are the next most frequent, especially during weeks with major news releases.
How do I anticipate which Weekly Profile is in play?
Read the higher-timeframe premium / discount arrays. The profile that is most likely is the one whose end state — Tuesday low into discount, Wednesday high into premium, Thursday reversal at intra-week extreme — aligns with the higher-timeframe bias and untouched arrays.
What is the Seek and Destroy Friday profile?
It is a low-probability profile where price chops Monday through Thursday running shallow stops on both sides, then expands sharply on Friday. It tends to print around major news events like NFP and rate decisions, especially in the summer months. Avoid trading these weeks.
What is the difference between Wednesday High of the Week and Wednesday Weekly Bearish Reversal?
The Wednesday High (profile IV) is the bearish weekly delivery — Wednesday is just where the weekly high prints. The Wednesday Weekly Bearish Reversal (profile XII) is the opposite — price drives into Wednesday’s high to raid buy stops at a long-term high, then reverses sharply for the rest of the week. Different intent, different trade direction.
Can Weekly Profiles be used on forex?
Yes. The profiles are most reliable on US index futures (NQ, ES) but the major forex pairs (GBP/USD, EUR/USD) and Gold (XAU/USD) also respect the same weekly delivery patterns.
What timeframe do I use to read the Weekly Profiles?
Daily for the day-by-day pattern, weekly for the higher-timeframe PD Array context, and 4-hour for the intra-day timing of weekly highs and lows. For intraday execution within a profile, drop to the 15-minute and 5-minute as usual.
Should I trade the Weekly Profile or skip the week?
Trade weeks where the higher-timeframe context clearly supports one of the high-probability profiles (I through VIII, XI, XII). Skip weeks that fit profile IX or X (Seek and Destroy Friday) — the choppy stop-hunt action makes execution unreliable.
ICT Weekly Profiles PDF Download
You can download below ICT weekly profiles in PDF for free. This PDF is sponsored by ICTPDF.COM.
To learn complete ICT Trading strategy step by step, you can buy ICT Trading PDF eBook on ICTPDF.COM.
✨ Update: I've launched my ICT Trading Strategies PDF eBook! Check it out at ictpdf.com .


Sir mery kch Questions wagera thay ICT or SMC ko ly ky agr ap mery questions ka jawab dy gy tou bohat mehbani hogi.
Yes sure, let me know your any question regarding ICT, SMC or related to forex. I will try to guide you to best of my knowledge.
Sb ys phly tou ya ky me kai dafa market me dekha hai ky ICT or SMC Trader Ki Condition ky mutabik koi be area wagera create hota hai likin wo fill howy bager move kardeta hai. Secondly ya ky ICT totally base he sirf Liquidity or Stop loss hunting py hai agr sary Reatil Trader ICT concepts ko use karky Trading karnny lgjay tou phir market me kis ky SL Hunt hogy or Liquidity create hogi jis ko ICT trader use karky apni Trade ko Execute karty hai.
SMC ho ICT ya Price Action, remember we can anticipate market move, we can not guarantee it will move like this.
So market hamary analysis ko follow karny ki bound ni ha na hi market ny har FVG/imbalance fill karna ha, we just see k konsy imbalance ya fvg ya order block main market ny kia reaction dia and according tothat hm apna decission lety hain.
2ndly ICT is not just about liquidity its basically time and price theory based on IPDA and still ICT traders lose too because even after mastering ICT we are still retail traders and we can just anticipate price move.
Sir ap ka bohat shukria ky ap ny mujhy reply keya or mery mind ky conepts ko clear keya.
No issue. You are welcome any time.
hello can you explain how to analysis daily bias ?
i will explain a simple bias-finding technique in next blog
refer to ICT One Shot One Kill Trading Model i have explained dealing range here
Hello sir
I like the way you teach.
Do you have any youtube channel so i can learn the videos
You can search @Tradetrack on youtube, I sometimes post videos there.
Sir, can you give a complete syllabus on ICT. So that we can complete the course step by step.
I will try soon. Working on that.
When are you going to talk about Breaker block and type of order block
already here ICT Breaker Block Trading Strategy – Explained with Examples
Somebody essentially help to make significantly articles Id state This is the first time I frequented your web page and up to now I surprised with the research you made to make this actual post incredible Fantastic job
Sir Weekly profile or Daily Bias ko master karna ma kitana time laga tha app ko
I’m trading from past 5+ years so it was not hard for me
For weekly profile, what do you use for marking range of the day? are they marked using midnight open or open close candle?
because midnight open is started from 00.00 to 23.59 and opening candle started from 17.00 to 16.59 at the other day
ICT Uses midnight open
According to the drawings, during a seek and destroy Friday, Wednesday and Thursday have to make high and low of the week?
yes
Hi, could you please add real market graph with analysis against each of profile?
Hi Suraj, good request. Annotated real chart examples for each of the 12 weekly profiles would make the post a lot stronger, and it is on my update list. I will add a labelled chart per profile showing the actual weekly high and low forming, in the next revision. For now, the fastest way to learn them is to open any past week on the daily, work out which of the 12 profiles it matched, and mark the high and low. Doing it in reverse like that locks them in quickly.