ICT Internal and External Range Liquidity – IRL and ERL

Do you want to master the art of Liquidity by learning about the ICT internal and external range liquidity?
Well, in this blog post we will teach you deeply about the ICT internal and external range liquidity from basics to advance via real market examples.
But before diving deep into ICT internal and external range liquidity we would be explaining some basic concepts to make it easy for you.
Why Price Move?
Have you ever thought that why price moves?
Basically price moves because of two reasons.
(I) To sweep the liquidity.
(II) To balance the Fair Value Gap .
What is ICT Dealing Range?
ICT dealing range is basically the area between an established Swing High (which has taken the liquidity of an old high) and an established Swing Low (which has taken the liquidity of an old low).

Now lets move forward to the ICT internal and external range liquidity.
What is ICT Internal Range Liquidity?
First of all you have to understand what is internal range.
Anything in between an ICT dealing range is termed as internal range.
But the only the Fair Value Gap is marked as the ICT internal range liquidity.
Now you may question why only the fair value gap is marked as internal range liquidity not the highs, low, or order blocks?
ICT Fair Value Gap is marked as the liquidity because it is a formation of three candles leaving an area between high and low of 1st and 3rd candle where price do not overlap.
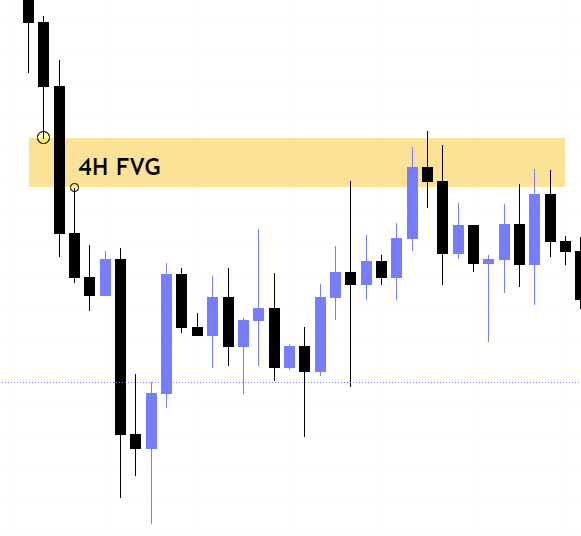
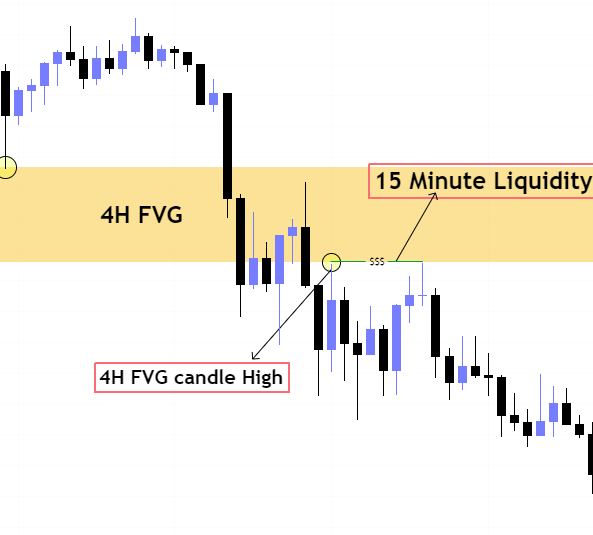
So the high/low of the candle forming the fair value gap is basically an established low and a liquidity level in lower time frame.
When price moves to balance the fair value gap it basically takes sweeps the liquidity in lower timeframe that is why fair value gap is termed as ICT internal range liquidity.
What is External Internal Range Liquidity?
Lets first understand about the external range.
The highs and lows of any ICT dealing range are termed as external range.
The high of an ICT dealing range is termed as “buy side liquidity” assuming the buy stops rest above the high of dealing range.
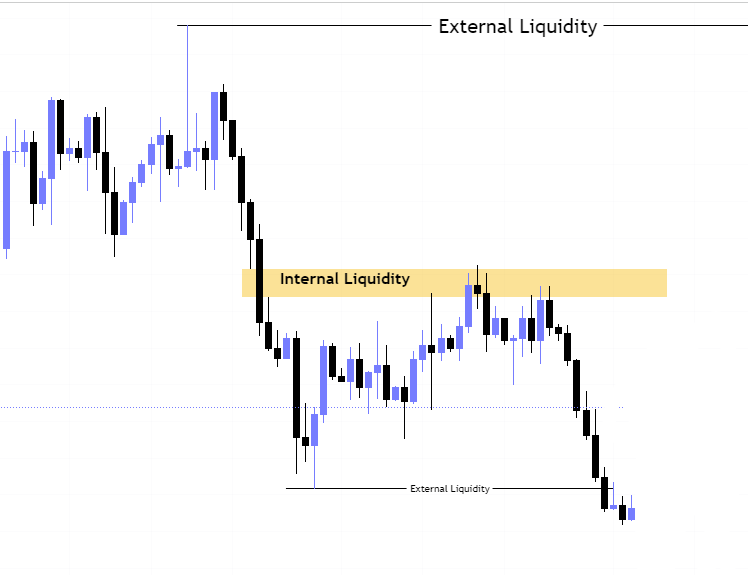
While the low of an ICT dealing range is known as “sell side liquidity” assuming the sell stops resting below the low of dealing range.
How Price Move to Take Liquidity?
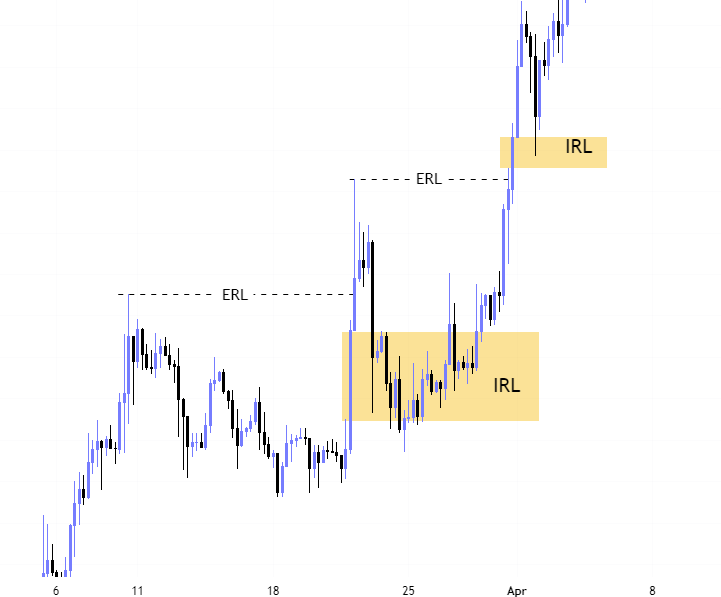
Price basically moves from “external to internal” and then “internal to external”.
So price after taking the external range liquidity moves toward the internal range liquidity to balance the fair value gap and then again price moves to the external range liquidity and this cycle continues.
Daily Bias Identification using ICT ERL and IRL
ICT Internal Range Liquidity (IRL) and ICT External Range Liquidity (ERL) concept is beneficial for identifying the potential daily bias.
To identify ICT daily bias follow these simple steps.
(I) IRL and ERL
As we discussed earlier price moves from internal range to external and external tointeral.
So identify the ICT internal and external range liquidity in daily/weekly chart near, above and below the current market price.
(II) Potential Bias
If price takes internal range liquidity first and the external range liquidity is resting above the bias should be bullish as price is gonna take the external range liquidity.
But if price takes internal range liquidity first and the external range liquidity is resting below the bias should be bearish as price is going to take the external range liquidity below.
We are mainly focusing on the external range liquidity because it lies within the major trend of market while internal range liquidities are taken by the price retracements.
(II) Scenarios after Taking ERL
1: In bullish market if price sweeps & closes below ERL (old high) with reversal/momentum shift in lower timeframe.
This is a sign of potential bearish reversal. The market may now go down to take the untouched IRL (fair value gap) below.
2: Price closes above the ERL while there is no reversal/momentum shift after reaching ERL (old high).
There can be two possibilities.
(I) Continuation of bullish trend: The market may continue its upward movement beyond the ERL.
(II) Consolidation: The market may consolidate around the ERL level before making another directional move.
NOTE
This method is based on the assumption that the market tends to fill liquidity gaps and balance imbalances.
It’s important to consider other technical indicators and market context alongside this method for confirmation before making trading decisions.
Back testing and paper trading are recommended to evaluate the effectiveness of this method in different market conditions.